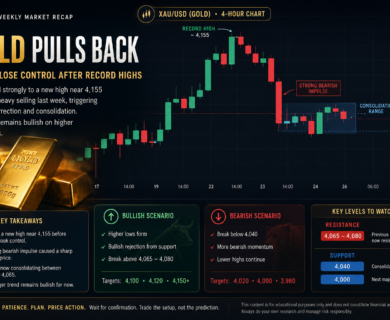
Gold Market Weekly Recap: Buyers Lose Control as Gold Pulls Back from Record Highs
Gold pulls back after reaching record highs. Read our weekly XAU/USD technical analysis, key support and resistance levels, and outlook for traders.

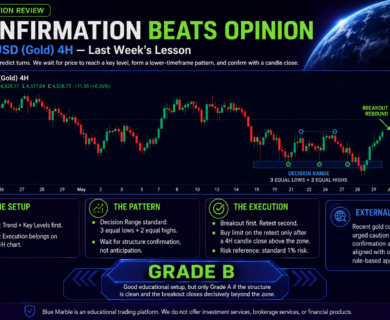
Stop guessing directional legs. Discover a practical rubric for grading gold structures, setting structural execution rules, and managing risk consistency through market streaks.
Learn how to analyze XAU/USD price action using a top-down technical approach. Master market structure, pattern validation, and objective execution.
Stop guessing directional legs. Discover a practical rubric for grading gold structures, setting structural execution rules, and managing risk consistency through market streaks.
The gold market (XAU/USD) is serving up textbook volatility this week, dropping nearly 2% over the last few days to hover around the $4,450 – $4,470 range. For short-term traders and scalpers, this tightening range presents a high-probability setup—provided you track the massive macro catalysts playing out in real-time.
We’ve had a lot of eyes on Gold recently. Stephen Whiteside’s latest precious metals update on Investing.com highlights a massive theme we drill into our students every day: urging caution and waiting for additional confirmation signals before jumping into volatile commodity reversals.When the retail crowd is scrambling to figure out whether to buy or sit on their hands, our system points directly to our rulebook. Let’s break down exactly how we map, grade, and execute a setup like last week’s Gold move using our core modules.