
Blue Marble Education: Review news for historical performance reference only. Events can cause high volatility.
Hey Team,
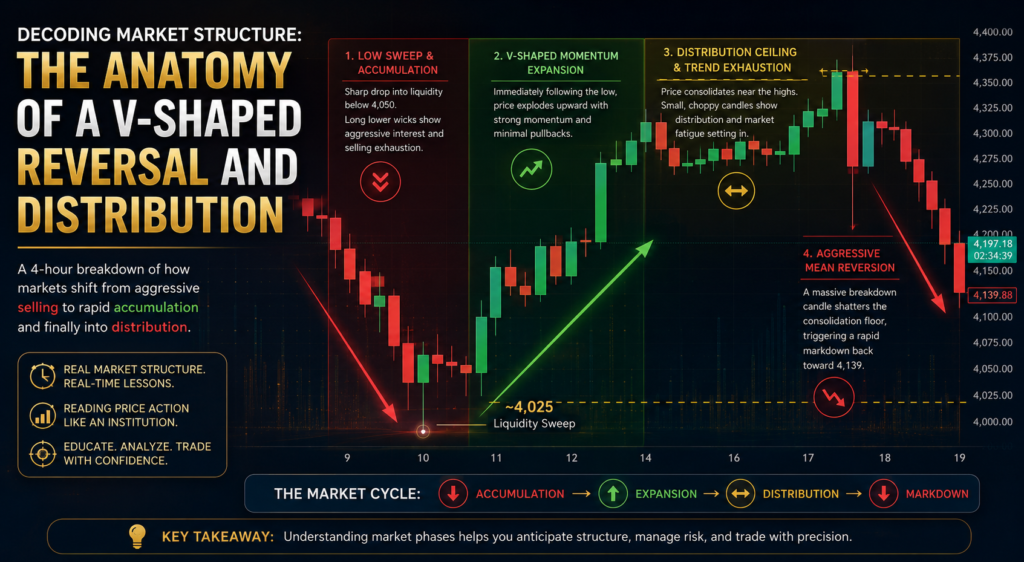
When observing historical performance on a chart, sudden shifts in momentum provide some of the cleanest case studies for reading structural behavior. Let's break down the recent 4-hour chart from the image to understand how market structures shift from aggressive selling to rapid accumulation, and finally into a distribution phase.
Looking at the left side of the image, the asset experienced a prolonged downward expansion, culminating in a sharp, definitive drop around the 11th. Notice the long lower wicks on those candles near the 4,025 level.
Following that low, the market didn't consolidate; it immediately launched into a rapid structural expansion upward. Between the 11th and the 14th, the image shows large, consecutive upward structural candles with very little minor pullbacks.
By the 14th through the 17th, the aggressive upward expansion slowed down significantly, consolidating into a tight ceiling below the 4,375–4,400 zone.
What goes up efficiently often unwinds just as quickly. As seen on the far right of the image leading into the 18th and 19th, a massive downward candle broke the consolidation floor, triggering a rapid markdown back down toward the 4,139 level.
Market cycles move through phases: Accumulation → Expansion → Distribution → Markdown. Using a 4-hour historical timeframe helps smooth out the lower-level noise to give you a clear look at where major structural shifts are occurring.