Better Together

Market Intelligence Feed

Blue Marble Education: Review news for historical performance reference only. Events can cause high volatility.
Trading Education
Gold Extends Bullish Momentum as Buyers Defend Every Pullback
Weekly Performance Reference & Structural Analysis (XAU/USD)

Hey Team,

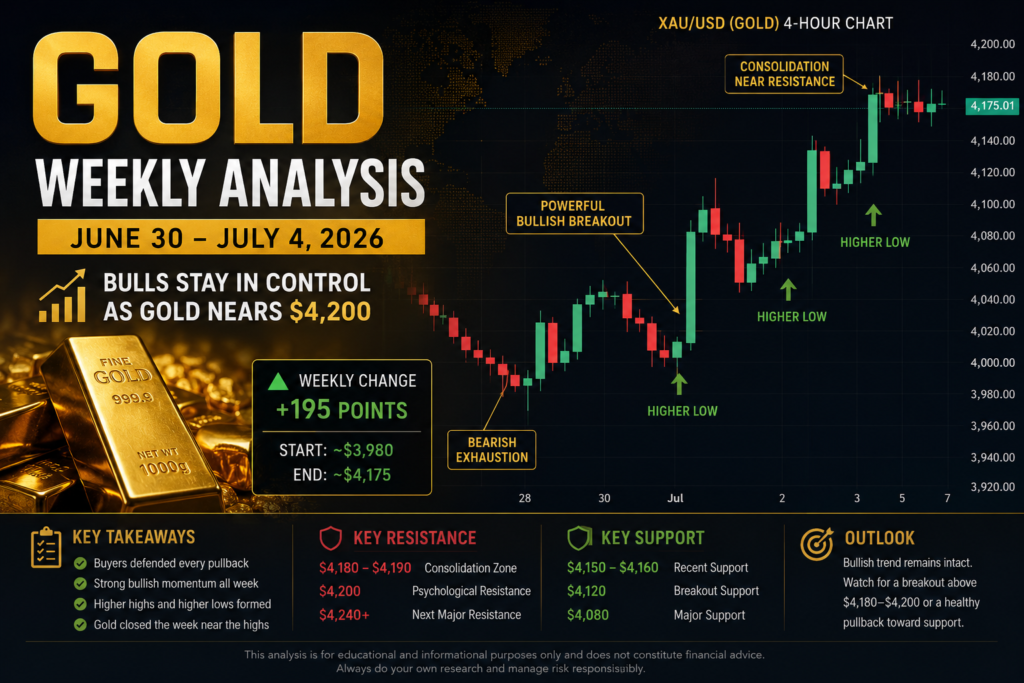
Gold finished the week with strong bullish momentum, climbing from around $3,980 to close near $4,175, representing a gain of approximately 195 points. Throughout the week, buyers consistently stepped in during every pullback, illustrating a clear shift in structural market sentiment in favor of higher prices.

1. Early Week: Bearish Exhaustion

The week started with uncertainty after gold experienced several bearish candles, continuing the previous week's correction. Characteristics included consecutive bearish candles, lower highs, and lower lows. However, although sellers pushed price lower, they failed to create significant structural continuation below the previous swing low.

The Lesson: In trading education, a failure to expand below key swing lows suggests selling momentum is weakening. This exhaustion is often the first warning sign that a structural reversal may be developing.

2. Mid-Week: Buyers Take Full Control

The turning point came with an explosive bullish candle that completely engulfed previous bearish momentum, broke above recent resistance, and closed near its absolute high. Following this breakout, gold began printing textbook bullish market structure: Higher High → Pullback → Higher Low → Breakout → Repeat.

The Lesson: Large, wide-range engulfing candles typically indicate aggressive buying conviction entering the market. After this expansion, every subsequent pullback became shallower, indicating buyers were eager to re-enter rather than wait for deeper discounts.

3. End of Week: Healthy Consolidation

Toward the end of the weekly chart, price began moving sideways just below the $4,180 ceiling. Rather than experiencing heavy profit-taking or a sharp reversal after the rally, buyers allowed price to rest and balance immediately below key structural resistance.

The Lesson: Sideways consolidation after a major upward impulse is generally considered healthy. It indicates that supply is being absorbed smoothly and can signal market preparation for the next directional move.

4. Key Technical Zones

Monitoring historical structural levels provides critical framework for mapping market scenarios into next week:

Resistance Levels

  • $4,180–$4,190: Current consolidation roof zone.
  • $4,200: Major psychological resistance barrier.

Support Levels

  • $4,150–$4,160: Recent minor consolidation support.
  • $4,120: Previous critical breakout area.
  • $4,080: Major structural bullish support.

Outlook for Next Week

The market enters the new week with buyers holding the technical advantage, but trading near a significant overhead resistance zone. Two primary paths are worth watching:

  • Scenario 1 (Higher Probability): A clean break above $4,180–$4,200 backed by strong breakout candles and successful retests to open up a fresh bullish leg.
  • Scenario 2 (Healthy Pullback): A temporary retracement toward $4,150 or $4,120, which would offer normal corrective behavior without invalidating the broader short-term uptrend.
🛡️ Disclaimer: Blue Marble is an educational trading platform. We do not offer investment services, brokerage services, or financial products. Always conduct your own analysis and use proper risk management.
Post Views: 14